
SKU Carbon Footprint: Build a Result That Survives a Product Revision
Original synthetic editorial photograph. Two staged unbranded variants, components, material samples and BOM sketch show product identity without a measured footprint. Object arrangement, connectors and branch or time direction carry the explanation; labels only identify major inputs.
Diagram text description
A SKU carbon footprint is a greenhouse-gas result for a defined sellable product configuration, not a number attached to a stock code forever. The code may identify a size, material, colour, supplier or pack. To interpret the footprint, a reader also needs the declared unit, life-cycle boundary, product revision, data period and method. Changing any of those can turn a once-valid number into a misleading one.
The work begins with product identity. Link the exact SKU to its current bill of materials, supplier inputs and manufacturing activities. Calculate each included contribution with compatible units and documented factors, then retain the source and calculation versions. The result can be used for a sourcing or product decision only within its stated scope. A public label or verified claim is a separate step with its own requirements.
This article is about governance of one product result across variants and revisions. It is not another generic formula-only guide. A team should be able to answer: which physical product does this number describe, how was it assembled, what is excluded, and what change would require recalculation? If those answers live only in a colleague's memory, the SKU field is not doing enough work.
Identify the SKU before looking for a number
Start with an identity record: SKU code, product name, variant attributes, supplier, manufacturing site, revision, sale unit and packaging configuration. A bottle sold singly and the same bottle in a two-pack may share components but not necessarily the same per-sellable-unit footprint. A material or colour change can alter production inputs; an unchanged sales code does not prove the physical product is unchanged.
Define the declared unit in ordinary words. “One finished item in its retail pack at the factory gate” differs from “one kilogram of unpackaged material” or “one item delivered to a customer.” State the date or production period represented and the geography of the relevant plant and suppliers. A product carbon footprint can cover different stages, so the boundary must sit beside the unit rather than be inferred from a dashboard label.
The two records are distinct versions, not automatically different footprints. The section explains the physical checks; the diagram does not claim every variant needs a separate study.
Diagram text description
Version the identity record before importing data. If procurement changed a supplier last month but engineering still holds an earlier BOM, a calculation using both records may describe no actual SKU ever sold. Assign one owner to confirm the product configuration and one to record the effective date. This small administrative step prevents a polished calculation from becoming untraceable the next time a variant is introduced.
Map the current bill of materials
The current BOM tells you what components are intended to form the SKU, but the PCF input register needs more than a list of part names. Capture quantities and physical units per declared product unit, material grades, sourced components, packaging and the applicable revision. Verify whether the engineering BOM describes finished component mass or the manufacturing BOM includes purchased input and process scrap.
Where assemblies contain nested subcomponents, preserve the relationship from finished SKU to parent assembly to component. One component PCF may be expressed per kilogram, another per item. The BOM link must carry the amount of each component used in the finished SKU and any necessary conversion. A shared part used in several variants should retain its own source record rather than being copied as an untraceable fixed emissions number in every product file. This is the structural spine of the SKU carbon footprint, not the entire model.
Partial product tree: each edge needs a quantity and unit in the underlying BOM. Factory activity and transport are not drawn as components and remain separate calculation inputs.
Diagram text description
Do not treat the BOM as the complete climate inventory. Factory energy, process fuel, direct emissions, packaging operations, inbound transport and waste treatment can sit outside the engineering component list. The selected method and boundary decide which are included. Use the BOM as the backbone that gives those activity records a place to attach, then reconcile it to purchasing and production evidence before calculating.
Request compatible supplier information
A supplier PCF for a purchased component can replace a generic material estimate only if it represents the right component, quantity and boundary. Ask for its declared unit, included processes, site or regional context, time period, methodology and assurance status. A value per kilogram of raw resin is not the same as a value per finished moulded part, even when both are supplied by the same company.
Record what portion of the studied SKU uses supplier-specific data and where secondary factors remain. Missing responses should be visible in a gap register with owner and follow-up date. A defensible proxy may be needed to screen a product, but identify its source and representativeness; never present it as a measured supplier value. If the missing component could dominate the result, test a range or postpone a comparative conclusion.
Separate scopes prevent counting the same material production twice. Final assembly is added only if absent from the supplier result; the diagram does not establish any actual supplier boundary.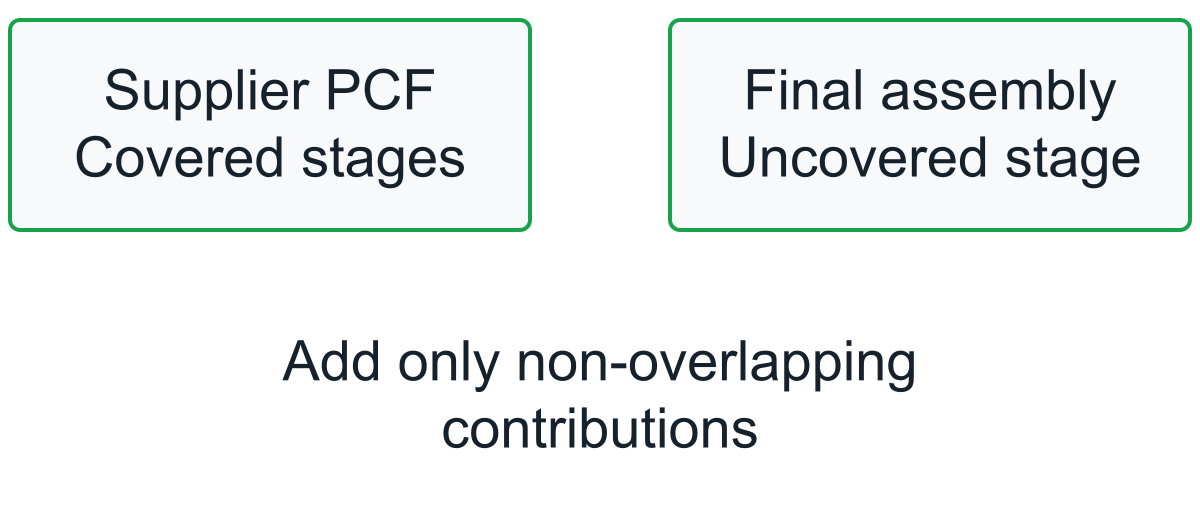
Diagram text description
Avoid mixing supplier boundaries. A purchased part's PCF might include its upstream material production and the supplier's own manufacturing. Adding the same material factor again would double count. Conversely, using only a cradle-to-gate raw material factor may omit the supplier's forming process. The data handoff should map every supplier figure to the stage it already covers and to the additional activities the final product study still needs.
Allocate factory activity to this SKU
The factory may make several SKUs on the same equipment. A monthly electricity meter and total output count do not automatically tell you the energy of one product. Choose an allocation basis that represents the process: measured machine time where reliable, process-specific consumption, mass, physical throughput or another justified driver. Document why the chosen basis fits the actual operation and whether idle or setup time is included.
For a mixed production line, a simple division by total items can distort high-energy and low-energy variants. Suppose one SKU requires an extra heating step while another does not. Assigning the same plant-average electricity to each would hide the process difference. Keep the activity source, the allocation driver, the period and the product quantities together so another reviewer can repeat the attribution. If only a coarse estimate is possible, explain its expected direction of error.
The same issue applies to direct process emissions, consumables, water treatment or waste where those are within the method boundary. A component supplier may report its part emissions, while the final plant must still add its own transformation stage. Make the separation explicit to avoid both gaps and duplicates. Revisit allocations when routing, yield or production mix changes: the SKU code alone cannot tell the model that the line was reconfigured.
- Isolate the measured activity and production period for the relevant process.
- Choose an allocation driver that reflects how this SKU uses the process, then reconcile all assigned shares to the measured total.
- Record the driver, calculation, reviewer and condition that would trigger a new allocation.
Reconcile units and pack sizes
Unit errors are common because product records serve sales, purchasing and engineering at once. The catalogue may store one item, procurement may buy a box of 50, and a component footprint may be reported per kilogram. Before multiplication, convert every input to the declared product unit. Record the conversion instead of embedding it in a hidden spreadsheet cell.
For example, if a part weighs 0.20 kg and a supplier factor is expressed per kilogram of that part, a single finished product uses 0.20 kg times the compatible factor, not the factor once per item. If the same part is purchased in packs of 50, the pack size belongs in purchase-volume calculations, but it should not multiply the per-finished-item footprint again. This is a unit example, not a carbon factor or real product result.
Conceptual conversion path. Fifty is an example pack size; no emission factor is assumed. A per-pack factor must not be applied fifty times to individual items.
Diagram text description
Check the units printed with every activity and factor: kilograms with kg CO₂e/kg, kWh with kg CO₂e/kWh, tonne-kilometres with kg CO₂e/tonne-km. Confirm whether a supplier PCF applies to a component, a bulk material or a shipment. A spreadsheet total can look precise while the calculation has confused grams with kilograms or cartons with items. A second-person dimensional check is often a high-value review step.
Calculate a reviewable product result
For each included line, multiply the activity amount by its compatible factor or scale a supplier PCF to the component amount. Sum the attributed lines per declared SKU unit, retaining the source and calculation version for each. Separate measured, supplier-reported and secondary-data contributions so the team can see where improved information would matter most.
The working register should show component or activity ID, quantity and unit, factor or supplier PCF, that value's unit and boundary, geography, data period, allocation basis, calculation expression, result, data-quality note and source locator. Do not strip away these fields when presenting a rounded headline figure. The result should be reproducible without opening an old colleague's email account or guessing which factor library was in use.
Perform a mass and activity reasonableness check. Reconcile the BOM to purchased input where scrap is significant, test whether packaging quantities are plausible, and check whether plant energy attributed to all SKUs sums back to the measured total for the period. A mathematically correct sum can still be wrong if a large component is missing or one supplier PCF is counted twice. Release a value only after the boundary and line items have been reviewed together.
When can variants share one result?
It can be efficient to calculate one representative footprint for related variants, but grouping needs an explicit rule and evidence. Some assurance programmes provide specific criteria for grouping materially similar SKUs and geographic markets. Those programme thresholds are not a universal licence to average unlike products. A red and blue variant might differ only in a small pigment input, while a smaller pack and larger pack could have substantially different packaging per item.
Ask whether the variants have the same function, material composition, manufacturing route, relevant suppliers, packaging and downstream scenario. If not, calculate them separately or model the difference transparently. If grouped, retain the member SKUs, production or sales weighting, tested variation and reviewer decision. The published unit must still make sense for every member of the group.
This is a partial classification, not an automatic approval tree. Material, packaging, factory and programme conditions remain in the section.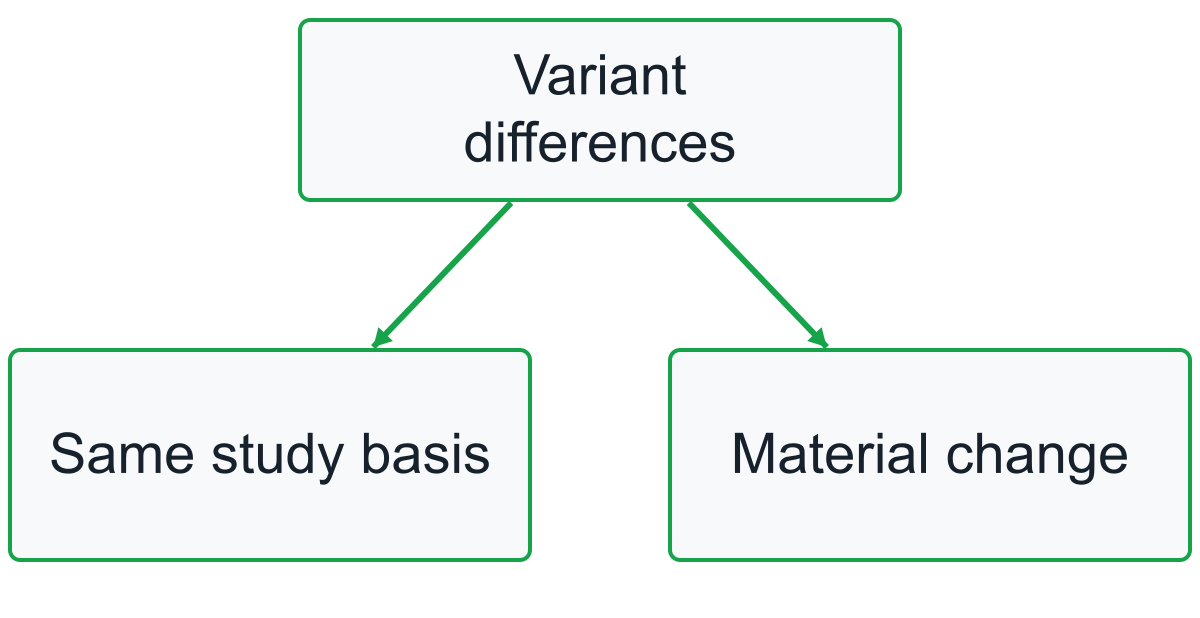
Diagram text description
Do not group merely to simplify a dashboard. A supplier substitution in one variant can break the rationale even if product names remain similar. The rule for continued grouping should be part of the change-control process. Where a programme governs an external label, use its current product-consistency and assurance requirements rather than borrowing a threshold quoted from a different scheme.
Why a company average is not enough
A company carbon inventory reports emissions across the organisation and its activities during a period. A SKU footprint attributes selected life-cycle emissions to one defined product unit. Those questions overlap but are not interchangeable. Dividing annual corporate emissions by the total items sold may blend products with different materials, suppliers, factories and boundaries into a misleading average.
Corporate data can still help: factory electricity, fuel and transport records may supply activity inputs. They need a defensible allocation to the studied SKU and a check that upstream supplier stages are included or excluded consistently. A company total may also contain office energy and activities irrelevant to this product model, while a product footprint may require upstream material data absent from the company ledger.
If a system shows both metrics, label them separately. The fact that they share a unit of kg CO₂e does not mean a company-wide value can be pasted into a product card.
Set triggers for recalculation
A SKU record should identify which changes force review: material grade, component mass, supplier, manufacturing site, energy mix, process yield, packaging, transport route, factor dataset or intended claim boundary. A change may be small enough not to alter a purchasing decision, but it should not be ignored by default. Log the change and have the method owner decide whether a recalculation is required.
Keep an effective-date trail. The record for revision A can remain valid for units produced under revision A; do not overwrite it with revision B's data and pretend historical units changed. When new supplier primary data replace a proxy, preserve the earlier estimate and document the new value's period and boundary. A material change log makes trend claims possible to inspect rather than a comparison of unrelated methods.
Sequence represents version applicability, not a mandatory fixed review interval or a claim of lower emissions.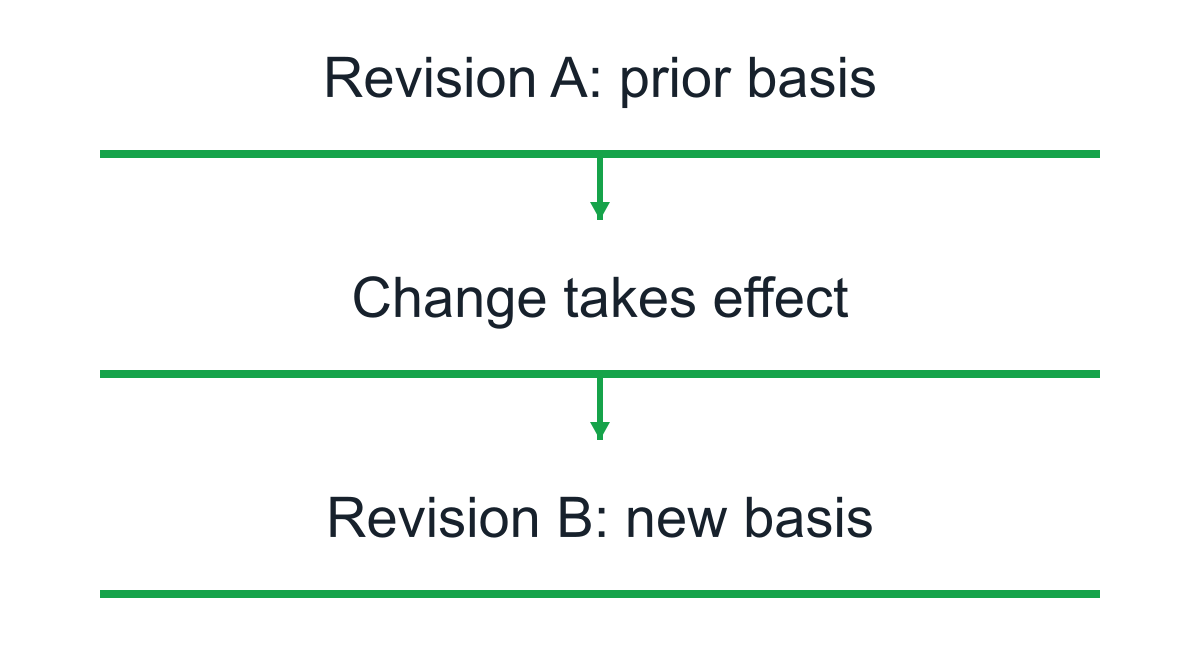
Diagram text description
Set a scheduled data review as well as event triggers. Supplier information and factor datasets age even when the physical product is stable. The review frequency depends on the study purpose and applicable programme, so assign an owner and a next review date rather than claiming one universal interval. The old result should display its status when no current check has been completed.
Build the SKU evidence record
Build one record another person could audit. At minimum, it should hold: SKU and revision; declared unit; system boundary and exclusions; product and plant geography; BOM version and component quantities; supplier inputs and their scopes; shared-activity allocations; factor sources, units and years; calculated line results and total; data-quality and uncertainty notes; reviewer; and a recalculation trigger. A linked source file or stable reference should support every material field. The SKU carbon footprint record can be organised like this:
Table 1: scroll horizontally if needed.
| Record field | Question it answers |
|---|---|
| SKU, revision and declared unit | Which physical sellable item and quantity? |
| Boundary and geography | Which stages and sites are included? |
| BOM and supplier sources | Which component quantities and upstream values? |
| Plant allocation and factor versions | How were shared activity and emissions attributed? |
| Quality, reviewer and trigger | What remains uncertain and when must it change? |
Give the record an explicit status such as “screening estimate,” “internally reviewed” or an actual verified status only when that review occurred. Record who approved the status and what evidence they examined. If a public-facing figure is exported, the export should carry the unit, boundary, product version and date; otherwise a number detached from its context may circulate long after the SKU changes.
Use the record as an exception queue. A blank factor source, unmatched component unit or unresolved supplier PCF boundary should stop an unqualified result, not disappear in a footnote. The goal is not a longer spreadsheet for its own sake. It is a small, repeatable evidence structure that tells the team what to fix before making a comparison or claim.
A worked revision: distinguish a lighter part from a new factor
Take a fictional product with three included contributions: a moulded part, packaging and final assembly electricity. This is a deliberately partial calculation to explain revision control, not a complete product carbon footprint. Transport, other parts, use and end of life are outside the teaching example. The part and packaging factors are assumed compatible with their purchased material boundaries; final assembly electricity is assumed not to overlap them.
For revision A, the part weighs 0.20 kg and its illustrative factor is 3 kg CO2e per kg of part. Packaging weighs 0.10 kg with an illustrative factor of 2 kg CO2e per kg. Assembly uses 0.50 kWh with an illustrative factor of 0.40 kg CO2e per kWh. Activity multiplied by a matching factor gives three contributions of 0.60, 0.20 and 0.20 kg CO2e. Their partial subtotal is 1.00 kg CO2e per specified item.
Table 2: scroll horizontally if needed.
| Included line | Revision A calculation | Contribution, kg CO2e |
|---|---|---|
| Part | 0.20 kg × 3 kg CO2e/kg | 0.60 |
| Packaging | 0.10 kg × 2 kg CO2e/kg | 0.20 |
| Assembly electricity | 0.50 kWh × 0.40 kg CO2e/kWh | 0.20 |
| Partial subtotal | Three non-overlapping included lines | 1.00 |
Part .20kg×3=.60; packaging .10kg×2=.20; assembly .50kWh×.40=.20. The second bar combines the latter two contributions. Total1.00kg CO2e, not a complete product footprint.
Diagram text description
Revision B reduces the part mass to 0.18 kg. Hold the factor, packaging, assembly activity and all stated assumptions constant. The part contribution becomes 0.54 kg CO2e and the partial subtotal becomes 0.94 kg. The 0.06 kg difference comes entirely from the modelled part-mass change. It says nothing about omitted stages or whether the new part provides the same performance; those questions must be resolved before interpreting the change as a product-level improvement.
Now consider a different event: the supplier revises the factor from 3 to 2.5 kg CO2e per kg, while the original part remains 0.20 kg. Recalculating revision A gives a 0.50 kg part contribution and a 0.90 kg partial subtotal. That lower estimate is caused by a source update, not by manufacturing the lighter revision B. Do not combine the two explanations or announce a physical saving merely because the latest spreadsheet total is smaller.
If both changes apply to a later analysis, calculate that case explicitly: 0.18 × 2.5 = 0.45 kg for the part, plus 0.20 and 0.20 for the other included lines, gives 0.85 kg CO2e. The four cases form a useful reconciliation: original assumptions, mass-only change, factor-only change, and both changes. They are alternative cases, not four contributions to add together.
Alternative partial subtotals from the fictional baseline1.00. Do not add these outcomes. Both changes together yield .85, explained separately in prose; full product ranking is not established.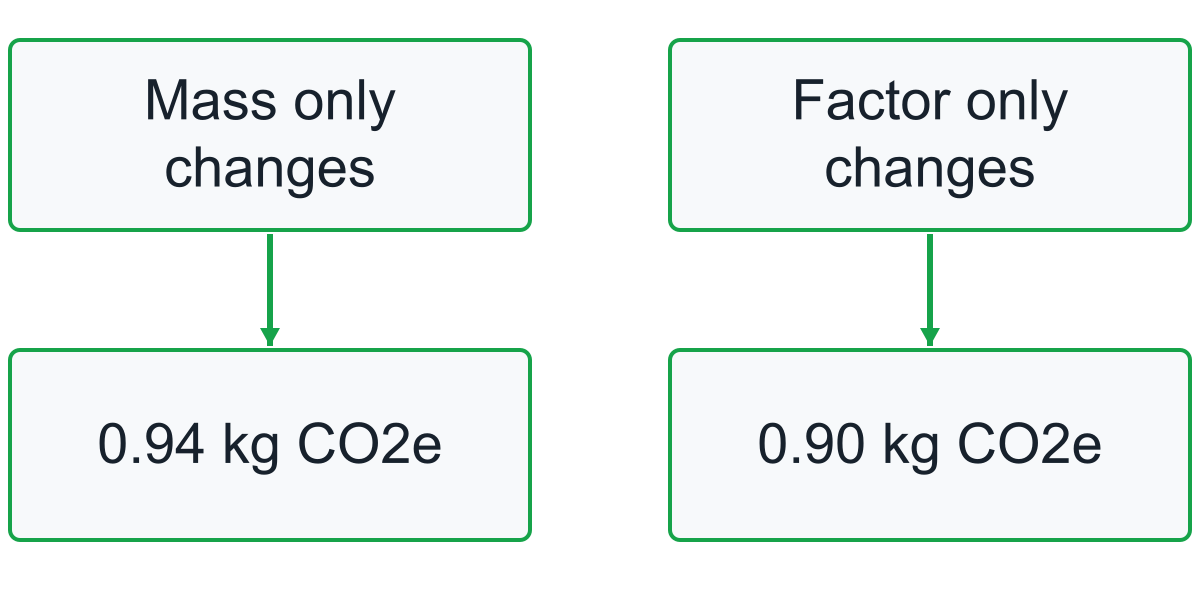
Diagram text description
Keep revision A's original calculation available beside any restated calculation. Its original factor may still explain a historical customer submission, while a consistently restated pair may be needed to assess the design change. The intended use determines which comparison is appropriate. A historical statement and a current like-for-like analysis can coexist when each identifies its product revision and source version.
This is also where a seemingly minor packaging change matters. If revision B switches to a multipack, the packaging line must be recalculated per declared finished item. Retaining the single-item packaging amount simply because the product name stayed the same would break the comparison. The stock code starts the lookup; the physical configuration and calculation basis determine the result.
A dependable result for the next product version
A dependable SKU carbon footprint survives a new product revision because its source trail is visible. The team can identify the exact configuration, reproduce the line calculation and tell whether a supplier, material or packaging change requires another result. Similar variants can share a footprint only under a documented, applicable grouping rule; if the evidence is not there, keep them separate.
Before using a figure, check four questions: Is this the SKU and unit being sold? Does the boundary include the stages the reader assumes? Are the BOM, supplier and factory data representative of this revision? Has someone reviewed the missing data and grouping decision? A “yes” should point to evidence, not simply a green dashboard status.
The result is then useful for its stated purpose: an internal product decision, a customer data request or, after appropriate substantiation and review, a public communication. Do not let a stable SKU identifier conceal an unstable physical product. The better system is the one that keeps the number, its assumptions and its update decision together.
SKU, BOM & supplier data